The Store Dashboard allows you to analyse the performance of one or more stores against other stores in a similar business environment. Eg – if your store was in a CBD area, you could use this report to compare your stores performance against similarly situated stores.
Correctly used, this report can provide invaluable insight into identifying opportunities to grow your business. At the same time, valuable business intelligence can also be gained on annual trends in each department.
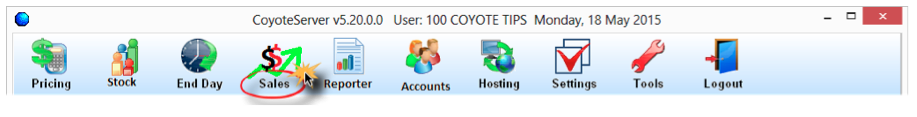
Select “Sales” from the Header menu
This brings up the “Sales History” screen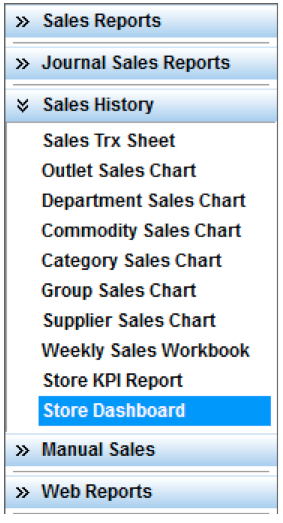 | Select “Store Dashboard” to access the next screen.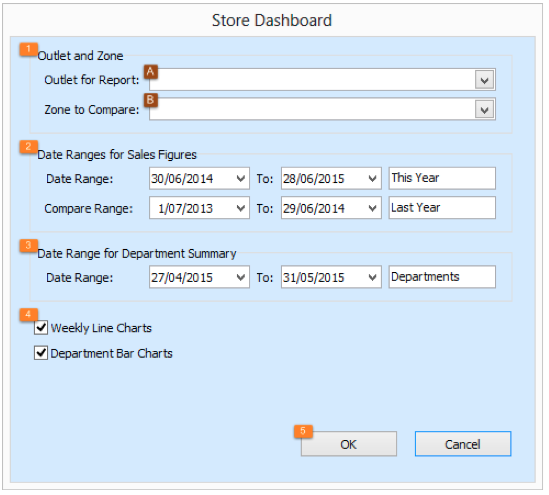 |
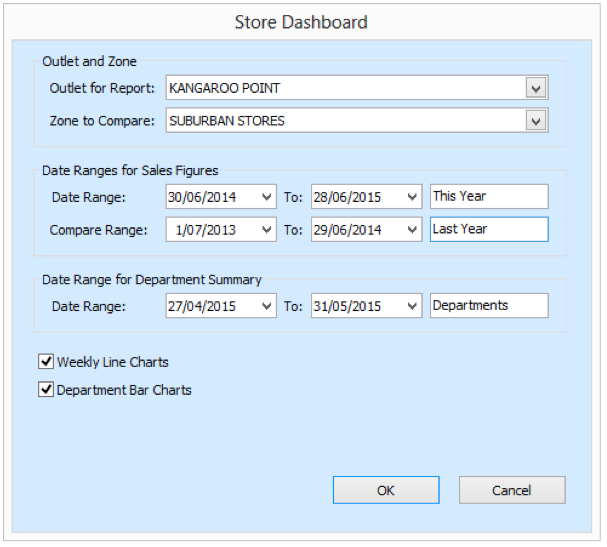
1: Outlet and Zone:
a. Select the Outlet you wish to base your review on
b. Select the Zone* that you wish to compare your base outlet against.
*Specific Zones are configured elsewhere within Coyote
2: Date Range for Sales Figures:
Default dates are the current financial year vs the previous years.
3: Date Range for Department Summary:
Default date is the current month.
In this example, we compare Kangaroo Point to other stores located in a CBD environment
The Dashboard returns information which is broken down into two separate sections.
Sales, GP, Basket Spend & Foot Traffic (Customer Count)
The first block of information is grouped in a column format according to the corresponding week ending date.
Sales:
- Store sales this year & last year by week
- Zone sales this year & last year by week
GP %:
- Store GP% this year & last year by week
- Zone GP% this year & last year by week
Basket Spend:
- Store Avg basket spend this year & last year by week
- Zone Avg basket spend this year & last year by week
Customer Count:
- Store Customer Count this year & last year by week
- Zone Customer Count this year & last year by week
The second block displays Basket Spend by Department at the store, across the zone and the basket spend at the highest performing location within the analysis zone.
4: Charts:
Selecting these options further enhances your analysis when exporting to Excel by generating easy to read graphs charts for each section.